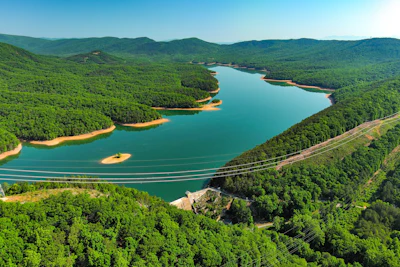
Just north of Roanoke, Va., is Carvins Cove Natural Reserve, the second-largest municipal park in the U.S. Amid its 12,500 acres sits the 630-acre Carvins Cove Reservoir, which holds approximately 6.4 billion gallons of water.
Carvins Cove is one of four reservoirs — all for drinking water — that are part of the Western Virginia Water Authority, which supplies water to more than 300,000 residents. It’s also one of the focal research points for Virginia Tech’s Center for Ecosystem Forecasting with regards to modeling inflows and outflows within the reservoirs.
Alongside sensors at various reservoir intake points, the research team has looked for a way to build upon those efforts and improve data collection in parts of reservoirs like Carvins Cove that are without sensors. The answer came from above: NASA satellite data.
A partnership decades in the making
The Western Virginia Water Authority has a long-standing relationship with Virginia Tech that dates back to the late 1990s. More specifically, they’ve worked with Dr. Cayelan Carey, a professor and the co-director for the Center for Ecosystem Forecasting, since 2012.
Over the course of that decade-plus-long partnership, Dr. Carey’s team has worked closely with the authority to put up monitoring stations at various inflow points around the reservoirs. In support of their modeling initiatives, the goal has been to measure the water’s chemical and physical properties, understanding changes as nutrients and water flow come in, interactions with the sediment layer at the bottom, and everything that’s involved in the water column above.
A large portion of the research started at the authority’s two smallest reservoirs: Falling Creek Reservoir, 21 acres, and Beavercreek Dam Reservoir, 69 acres, (The fourth reservoir is the Spring Hollow Reservoir, which holds 3.2 billion gallons of water). The model then carried over to Carvins Cove.
In the summer months, the research team goes out by boat and takes snapshots along different portions of the reservoirs. Access to satellite data provides a more convenient, year-round view.
What the view from above adds
The new research project is supported by a $600,000 grant from NASA. And while the project is in its early stages, the Western Virginia Water Authority can already see the value in the satellite insights.
“It gives us a much better understanding of how the flows interact in the reservoir,” noted Jamie Morris, capital improvement project manager at Western Virginia Water Authority.
To Morris’ point, that understanding of detention time, or how long water takes to move through the reservoir, carries a lot of weight.
“If there’s an upstream oil spill, there’s a much better idea of how quickly it may reach the intakes,” he stated.
Operators can use that extended window to alert staff, increase monitoring, adjust treatment, or close the intake if needed.
The satellite data also shows the current shoreline of the reservoir.
“If you have an accurate bathymetry map of your reservoir, you can use that shoreline change to predict what the current volume in your reservoir is,” Morris noted.
For any utility, a reliable read on current volume helps with planning for dry spells, anticipating shortfalls, and deciding when to ask customers to conserve.
The Western Virginia Water Authority has discussed installing markers along the existing shoreline to compare that data with the information that the satellite observations show.
Starting with the operator’s questions
What information would be valuable to the water authority?
Morris describes the relationship with the Center for Ecosystem Forecasting team as very interactive, with this question being a consistent part of it all.
A current focus is around chlorophyll A and predicting algae concentrations at various parts of the reservoir. The authority is in talks with researchers about creating a color-coded map with a gradient of the different densities they’re seeing for chlorophyll A. Potentially, it could be a map that compares the previous satellite imagery with the current shot to show visually what moved.
This operator-centric model plays well to the research team’s goal of leveraging this model in other bodies of water in the Appalachia area and elsewhere.
While seeing its value for the Western Virginia Water Authority, Morris also sees the impact other types of data could have on utilities based on the challenges and concerns they face.
He uses the example of toxic algal blooms, which fortunately aren’t a big issue for his authority but he recognizes are a big focus for other water authorities.
Lake Erie is a well-known case. Harmful algal blooms, fueled in part by nutrient runoff, have recurred in the lake’s western basin for years. In 2014, a bloom near the city of Toledo’s water intake led to a do-not-drink advisory affecting roughly 400,000 residents.
“Imagine if you had satellite imagery looking at chlorophyll A in Lake Erie, where we know there are significant problems with algal blooms at times,” Morris stated. “If they were able to predict something that’s growing near the intakes or potentially within the range of their intakes and they’re given a longer notification, that would be huge so they can prepare or do what they can to prevent the impacts they may have to deal with otherwise.”
While it’s early in the satellite data part of the project, the overarching message is clear. When operators and researchers work collaborate, the view from above can become a better view of what’s ahead.