
In most cities, water management is approached from the capital side and the utility side—and those two sides are typically siloed. When it comes to capital planning, predictive modeling and operational research often live in separate systems that were never built to talk to each other. Alence Poudel
“There is either a lot of research work and predictive modeling in the capital or operational side, but there’s a bridge missing that would put both into one place,” says Alence Poudel, senior engineering manager for the city of Sugar Land, Texas. “We don’t want a silo of a model where one thing works in one domain.”
Sugar Land’s own infrastructure makes the problem concrete: separate, unrelated models for its water, wastewater, and lift station facilities only make capital planning decisions harder.
Poudel’s answer is what he calls a dual horizon framework, one that combines the capital planning horizon and the operations horizon by integrating them through GIS, so both are solved within the same module rather than two disconnected efforts.
He applied that framework to Sugar Land, a city with 35,000 assets spanning more than 650 miles.
The framework in action
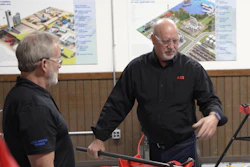
After combining Sugar Land’s asset inventory with more than 1,410 recorded water main breaks spanning 25 years, the team developed models for long-term capital planning and near-term operational targeting. Poudel and his team received the Innovative Technology of the Year Award from the Water and Environment Association of Texas (WEAT) for their framework. | Photo courtesy of Alence Poudel
“We use gradient boosting—specifically XGBoost—to figure this out, but we enhanced it with additional features,” Poudel explains. “We have your inventory information and break information to run a model classification problem on break or no break, but we started adding additional features to further enhance it.”
These features include the pipe’s joint type, its recent break history, and whether other breaks occurred nearby during the previous three years.
“Age and expected service life are useful predictors, but exceeding an expected service life is not itself an observed failure,” Poudel says. “To understand which pipes are actually more likely to fail, the model also needs to consider material, diameter, joint type, prior break history and nearby break activity. We started simpler approaches and then moved to gradient boosting. The goal was not to select the most complicated model, but to identify the approach that met the validation, calibration and operational requirements. In our case, that was the enhanced XGBoost.”
This would help cities determine where breaks are more likely to occur in the next year and which pipes should be inspected first. For utilities, it would clarify what to prioritize from a workload standpoint so field operations managers could dedicate crews to inspections and customer complaints more effectively.
“Then, we spatially cluster this information into a CIP program to get constructible projects with a timeline,” he explains. “It tells us what infrastructure projects to prioritize over the next five years.”
Poudel says commercially available tools can offer value, but a model developed for many utilities may not automatically reflect the conditions of one particular system.
“If an existing solution works with your data and operating environment, that is a great outcome,” he says. “But if it does not, the answer is not necessarily to keep investing in a more complicated algorithm. First understand the readiness and quality of your data, how your system is behaving and what decisions the model needs to support. Then tailor the approach to the utility’s actual needs.”
That local fit is especially important for public utilities, where limited ratepayer, public, and tax dollars must be allocated through transparent and defensible decisions. The objective is not to use the most complex model available, but to use an approach that has been validated, can be explained, and meaningfully reduces risk.
The model also highlights the cost of inaction. But knowing what to prioritize is only the first ask from leadership. Once results start coming in, the next question is almost always how much further those results can go.
Solving additional infrastructure management problems
The framework handles a common follow-up challenge: cost-to-target planning, which it solves through what Poudel calls gap analysis. If leadership is impressed with the initial results and wants answers to see further progress, how should utilities respond?
For instance, a city invested $10 million to replace 6.3 miles of pipe and reduced the break rate by 50%. Leadership would like to know how much money it needs to reduce the break rate by 80% and ensure the risk in the system is less than 15 on scale from one to 25.
“The framework does a gap analysis to tell you the answer. You invested $10 million, and now you need an additional X dollars,” Poudel explains. “Let’s say you need $3 million over the next four years to guarantee the system-level risk will be lower than 15 at that point in time.”
The capital horizon estimates which groups of pipes are approaching higher long-term risk, how much remaining life they have, and what level of capital investment may be needed. And instead of relying on data from manufacturers, the framework uses an approach that combines local information with manufacturer information to create a curve that’s more representative of a city’s scenario, also known as the anchored Weibull curve.
Following an accurate model
Before using the anchored Weibull curve, Sugar Land followed an Integrated Asset Management System (IAMS) to model pipe risk over time. It technically worked, but it assumed that every new pipe had some risk of failure right away—a pattern that didn’t match what the city’s break data showed. There was a real gap between what the manufacturer’s curve predicted and what was actually happening on the ground.
The anchored Weibull curve closes that gap by combining manufacturer assumptions with the city’s local break history.
The difference is clearly shown by an 45-year-old asbestos cement (AC) pipe cohort. A curve based only on observed breaks estimated approximately four years of remaining life, while the manufacturer-based curve estimated about 20 years. The anchored Weibull approach produced an intermediate estimate of roughly seven years.
“This matters for utilities because it gives them a defensible budget to city council and leadership,” Poudel says. “They would also avoid replacing pipes too early, which is a waste, or too late because that’s going to increase your breaks and liability.”
That particular pipe is just one example. The Sugar Land team went on to test the anchored Weibull curve on a much larger data set.
Testing for the long term
Over the last 25 years, only 1,410 of Sugar Land’s 35,281 assets ever recorded a break, about 3.7%. That imbalance creates a challenge for any model: simply predicting “no break” every time would already be right 96% of the time, while catching zero actual problems. Rather than optimizing for accuracy, Poudel’s XGBoost model focused on how well it performs on that rare 3.7%.
To test it fairly, Poudel’s team used temporal validation rather than randomly dividing historical records into training and testing sets. The model was trained using data through 2023 and tested exclusively against actual 2024 outcomes, mimicking how it would be used to forecast a future year. It was then applied prospectively to develop the city’s 2025 risk ranking.
Here are some notable findings from that test:
- The enhanced XGBoost model achieved an area under the curve (AUC) of 0.934, indicating a strong ability to distinguish between higher-risk and lower-risk pipes.
- At a probability threshold of 0.75, the model identified a list of 2,676 pipes that included 35 of the 43 breaks recorded in 2024, a recall of 81.4%.
- If Sugar Land had inspected only the 200 highest-risk pipes identified by the model, that list would have included approximately 14% of the breaks recorded in 2024
- At the same list size of pipes, the enhanced XGBoost model captured more than twice, 35 of the 43 breaks recorded in 2024, compared with 18 using an oldest-first ranking.
“That information makes it easier to align capital planning with field operations,” Poudel says. “It also gives us evidence to explain why certain assets and projects are being prioritized and what level of risk reduction we expect from the investment.”
Sugar Land is also exploring how to make the framework easier for utility leaders to use. Data engineers and civil engineers may need to review confusion matrices, AUC, precision and recall to validate a model, but utility directors and executive leaders often need the findings translated into operational and financial questions. These include:
- What is the greatest risk?
- What action is recommended?
- What impact is expected?
- How much investment is required, and where are the remaining funding gaps?
Poudel envisions adding a plain-language interface, potentially supported by a large language model (LLM), above the analytical framework. Rather than asking leaders to interpret technical model metrics, the interface could communicate validated results in clear language and allow users to ask questions about priorities, costs, expected risk reduction and funding needs.
“The language model would not replace the engineering analysis or make the final decision,” Poudel says. “It would serve as a communication layer, helping leadership understand what the validated models and the underlying data are showing.”
Sugar Land isn’t just replacing pipes anymore; it’s replacing the right ones, on a timeline it can defend.
For more details on Poudel’s research, read the full peer-reviewed paper on the American Water Works Association’s Water Science Journal: https://awwa.onlinelibrary.wiley.com/doi/10.1002/aws2.70052