
When New York water systems submitted their lead service line inventories to the state in late 2024, the data technically existed. Nearly 3,000 systems had complied with federal requirements to identify where lead and possible lead pipes might still be in service.
What didn’t exist was a way for residents, utilities, or policymakers to actually see the scope of the problem.
That gap is what prompted the New York League of Conservation Voters Education Fund to build a statewide, public-facing map of lead service lines—using GIS tools made available through the Esri Nonprofit Program. The result is an interactive platform that turns raw compliance data into an operational and political tool, at a moment when utilities are staring down fixed replacement deadlines and shrinking federal funding.
From federal mandate to public visibility
The origins of the map trace back to revisions to the federal Lead and Copper Rule. For the first time since 1991, the EPA required every water system in the country to submit a detailed inventory of service line materials, including whether lines were known to be lead, non-lead, or of unknown composition.
“We were aware in 2021 when the federal EPA put out the Lead and Copper Rule revisions,” said Josh Klainberg, senior vice president at the New York League of Conservation Voters Education Fund. “That particular revision included a provision for an inventory for October of 2024 for every water system around the country, detailing what material and the location was of the service lines.”
The inventory requirement was significant, but the organization worried the data would remain functionally inaccessible. To avoid years of public-record requests and fragmented disclosures, NYLCV helped push state legislation in 2023 directing the New York Department of Health to release the inventory publicly.
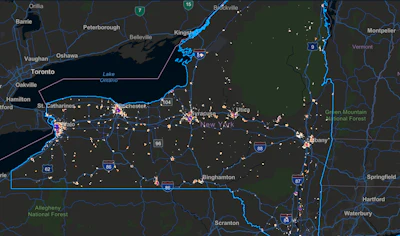
 A close-up view of Buffalo, N.Y., from the GIS map.
“When October 2024 came, the state started putting out reliable data,” Klainberg said. “But there was no map. There was no visualization. We had been hearing it would take a couple of years for the state to get around to doing that.”
Rather than wait, the nonprofit moved ahead on its own.
Cleaning the data before mapping the problem
Accessing the inventory was only the first step. The dataset itself needed significant work before it could be visualized.
“You have nearly 3,000 water systems that submitted their inventories,” Klainberg said. “There was a template they were supposed to follow. Things didn’t always line up. Several hundred systems didn’t submit at all.”
The state had collected the information, but did not have the staff capacity to standardize it for mapping. NYLCV took on the work of harmonizing submissions, identifying gaps, and preparing the data for public use.
See the map here.
The goal was not simply to publish numbers. It was to create a tool that could be understood at multiple scales, from statewide policy discussions down to individual households searching their address.
“The most important information is getting out to affected households about the presence of a lead or possible lead pipe,” Klainberg said. “Then you get that same information to policymakers who are developing policies and funding strategies for the next phase, which is removal.”
Why GIS changed the conversation
The technical foundation of the project came from Esri’s Nonprofit Program, which provides heavily discounted access to ArcGIS software, training, and curated datasets.
“We don’t often see people huddling around a spreadsheet so much as we do huddling around a map,” said Emily Swenson, nonprofit program manager at Esri. “GIS provides actionable, accessible insights. Most data has an element of location, and GIS lets you see patterns and relationships that are hard to grasp otherwise.”
For nonprofits, the barrier to entry has traditionally been expertise and cost. Swenson said both have changed.
“You don’t have to have a GIS degree to make compelling maps anymore,” she said. “We’ve invested a lot in making the technology easier to use, and in creating thousands of online training resources that are no cost to our users.”
NYLCV used those tools to turn service line records into a layered public interface. The map allows users to zoom from regional heat maps to individual service lines, while filtering by city, county, or legislative district.
“The map becomes a tool for taking action,” Swenson said. “It’s not only showing where problems exist today. It helps people think about where problems could exist, and how to prioritize responses.”
A tool utilities didn’t have time to build
While the map was created by an environmental nonprofit, its implications land squarely in utility offices and city halls.
Many utilities now face a planning challenge that extends well beyond compliance reporting. They must sequence replacements, coordinate street work, justify funding requests, and communicate clearly with customers—often without internal GIS teams or data staff.
GIS allows those challenges to be broken into manageable parts, Swenson said.
“You can bring in demographic data, population data, and start asking where the most people are affected, or where there have been historic disinvestment patterns,” she said. “That helps utilities decide where to act first with limited resources.”
Klainberg emphasized that the map is already reshaping policy conversations.
“When people see the dots, you see their expression change,” he said. “They move from ‘lead is bad’ to realizing how many constituents are affected. That’s when the political pressure starts to build.”
The risk of doing the minimum
The map also exposes what happens when utilities interpret ownership boundaries narrowly. Klainberg pointed to New York City’s recent submission of a compliance plan that assumes no responsibility for replacing privately owned service lines.
“Under their interpretation, New York City would comply in 47 years,” he said. “There’s no path to meeting the federal requirement.”
"DEP’s records indicate that there are approximately 121,100 known lead or galvanized service lines," according to the city, "but because all known LSLs in New York City are privately owned, DEP cannot simply mandate replacement."
Klainberg worries other systems may adopt similar positions unless states provide clearer direction.
“Our concern is that this varies from zip code to zip code,” he said. “We want a consistent policy where every water system offers replacement at no direct cost to homeowners.”
The map strengthens that argument by making inaction visible.
A replicable model
With federal infrastructure funding winding down, states and utilities are entering a period where clearer planning and stronger justification will matter more. New York’s governor recently announced in last year's State of the State address a $3.75-billion state water infrastructure commitment over five years, increasing the stakes for how projects are prioritized.
“This puts water systems in a much better position to ask for assistance,” Klainberg said. “If you have a plan, if you’re taking charge, you have a basis for asking for public money. If you don’t, you don’t.”
For Water Daily readers, the lesson is less about one map and more about the model behind it. A nonprofit, using a nonprofit-focused GIS program, stepped in to do work that utilities and agencies often lack time or capacity to complete on their own.
As lead service line replacement shifts from inventory to execution, tools like this are becoming part of the infrastructure itself.