Drought is part of daily life for tens of millions of Americans. While naturally arid western U.S. states are experiencing prolonged dry spells, even states that typically receive abundant precipitation have faced severe drought in recent years.
Last summer, Ohio suffered its most intense drought in over two decades, reaching the Exceptional Drought (D4) level on the U.S. Drought Monitor. This tracking tool became vital for crisis response, especially for parts of the state undergoing their highest-ever measured drought severity, said Aaron Wilson, Ohio’s state climatologist.


The U.S. Drought Monitor is produced jointly by the National Drought Mitigation Center (NDMC) at the University of Nebraska-Lincoln, the United States Department of Agriculture and the National Oceanic and Atmospheric Administration. Unlike a typical weather map, the monitor is not a forecast model – rather, it provides a snapshot of recent conditions, measuring precipitation, streamflow, reservoir levels, temperature, soil moisture, and a host of other data sets.
The surveillance tool is crucial for experts like Wilson, who shares real-time drought information from it with an active listserv of agriculture officials.
Weekly updates to the drought monitor are a blend of physical indicators and field observations from a wide-ranging network of specialists. Granular data collection provides farmers, communities and water resource managers with the means to effectively respond to drought, noted Wilson.
“What helps is having that local information – that’s what I take seriously,” said Wilson, also a field specialist for Ohio State University’s college of food, agricultural and environmental sciences. “We have weekly calls with an agricultural crops team that provides local rainfall estimates and observations of ponds and field conditions. Our goal is to make the (monitor) author’s job easier when looking at data for Ohio.”
A unique review process
Due to budget constraints and the availability of scientists with other primary roles, lead authorship of the monitor rotates among teams of meteorologists, climatologists and computer scientists, said Brian Fuchs, a lead climatologist with the national drought center.
Combining expert interpretation with diverse datasets creates a “convergence of evidence,” making the collective information more robust than any single piece, Fuchs added. Recognizing emerging drought – or determining when a drought is over – requires understanding what’s normal for a given location and season, usually through observation of weather patterns. Intense heat can dry out an environment quickly, although the monitor does not show drought intensification by more than one category per week.
“It’s unique because of the peer review process,” said Fuchs. “People will say, ‘I’m in eastern New Mexico, here’s the data to support what’s happening in my area. ‘These people are very familiar with their backyard, and can pass that information along.”
Monitor contributors harness satellite records as well, with precipitation a driving indicator for drought measurement. Technology has evolved since the system’s 1999 debut, meaning researchers can now better measure soil moisture, surface temperature and additional key metrics.
The finished map uses six color-coded classifications: normal conditions, abnormally dry (D0) -which shows areas going into or coming out of drought – and four levels of drought: moderate (D1), severe (D2), extreme (D3) and exceptional (D4).
Prior to the monitor’s inception, researchers relied heavily on the Palmer Drought Severity Index, which uses temperature and precipitation data to estimate a landscape’s relative dryness. Though reasonably successful at quantifying long-term drought, the index had a limited scope. Scientists Mark Svoboda and Doug LeCompte created the new monitor to better show the extent and severity of drought.
“It went from an experimental product to full production within months,” Fuchs said. “While the metrics have changed, the methodology is consistent.”
What’s it all for?
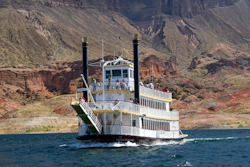
In 2012, a severe drought covered more than 60% of the U.S. Western states continue to grapple with a “megadrought” that has led to drinking water shortages and reduced water availability for agriculture, industries and households. In 2022, Lake Mead – the largest reservoir in the U.S. by capacity – fell to critically low levels following years of extreme dryness.
Environmental experts believe the drought monitor can help mitigate the worst of this crisis’s downstream impacts. The USDA, for instance, utilizes the tool to initiate disaster declarations, while local decision-makers use it to trigger rapid response in their communities.
“Water managers use it to find out where their supply is,” said Fuchs. “They have to pay attention to the monitor to provide for their customers and municipal users.”
Ohio is generally a water-rich state, benefiting from the Great Lakes and consistently reliable precipitation. Having more water than out west does not guarantee protection from drought, making resources like the national monitor of the utmost importance, said Wilson, the state climatologist.
Outreach, meanwhile, is an essential part of Ohio’s toolkit for drought education – Wilson gives upwards of 80 talks a year to agricultural groups and other stakeholders. Yet, recent federal cutbacks to agencies like NOAA and the National Weather Service are making Wilson question the longevity of this work.
“From a political standpoint, this is not a bipartisan thing, it’s about understanding what drought is,” said Wilson. “When these agencies go away, a lot of these products will go away. We need a strong network to understand drought and continue to be part of that process.”
Fuchs, the researcher at the national drought center, stressed the importance of all user groups understanding the monitor’s intricacies and staying updated on any changes.
“That’s a huge part of this,” said Fuchs. “The biggest request we get is people asking what the monitor is, and what goes on to make the map.”