
Utilities are beginning to use AI to guide asset management decisions, but not all models are built the same and not all outputs reflect local reality.
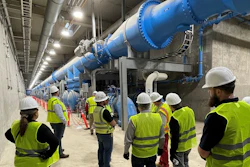
One presentation at the Texas Water Conference in San Antonio, Texas, focused on AI preparedness in water and wastewater operations. Three engineers from the city of Sugar Land—Paola De La Torre, Carla Barrios, and Alence Poudel—aimed to help operators determine if they should use AI in their operations.
As AI use continues to rise across the water and wastewater industries, two things remain clear: Operators can’t trust AI fully, and the quality of their data inputs determines the quality of their outputs.
Let’s break down why.
Using Large Language Models (LLMs) in the water industry
LLMs like ChatGPT, Claude, and Gemini have made AI commonplace in almost every industry. People use these platforms like search engines, asking them questions or to interpret datasets for them.
The latter is a popular use case for water engineers.
“AI is reshaping civil engineering practice, and we need to make sure we’re not misusing it,” Barrios says. “In order to do that, we can’t feed AI copy data, because that will give us the generalized narrative.”
Barrios and her team identified four critical gaps in LLM models for water infrastructure:
- Predictive models are validated but not connected to generative advice.
- LLM outputs are coherent but tend to drift from real data.
- Civil engineering lacks structured audits to these outputs because they don’t exist.
- In order for AI to be used responsibly, it needs to be grounded in local data and supported by governance.
To fill these gaps, the Sugar Land team created a four-step audit:
- Ground everything in local data. Build a predictive risk model that uses your own asset inventory and failure history.
- Prepare your factor card. Look at your scope, your model, and your top predictors to distinguish the asset attributes that drive failures.
- Test the AI platform. Check to see if your AI is aligned with local data or if it defaults to general assumptions.
- Turn comparison into action. Compare how often AI emphasizes each pipe factor—length, age, and material—against the model’s ranking. The Sugar Land team accomplished this by using a divergence ratio. “If it’s greater than 1.2, the factor is overemphasized,” Barrios explains. “If it’s between 0.8 and 1.2 it’s aligned, and if it’s under 0.8, then it’s underemphasized.
Understanding the steps of the audit is one thing, but applying it to a real-world situation paints a clearer picture.
Applying the audit to real-world scenarios
Sugar Land is a suburb about 20 miles south of Houston. It’s a mid-size city that has 670 miles of pipe—that equates to 35,000 assets. Over the last 30 years, the city has experienced 1,410 breaks, making the pipe break ratio 3.97.
“We want that number to be as low as possible,” Poudel says. “If our system has the minimum number of breaks, that’s what’s best for operations.”
The Sugar Land team entered this data into three different machine learning algorithms to test for breaks: logistic regression, random forest, and XGBoost. The team decided to focus on XGBoost because it proved to be the most stable platform based on its higher AUC (area under the ROC curve) score.
Team members asked XGBoost which factors contribute to pipe breaks the most. Using the local data it received, the algorithm said that pipe age and length are the two primary factors that contribute to main breaks. They asked Claude, ChatGPT, and Co-pilot the same question—all three LLMs said that pipe material is most responsible for main breaks.
After performing additional research and looking at different data sets, the Sugar Land team discovered that LLMs were overemphasizing pipe length and age while also taking “phantom factors” like pressure into account.
“Pressure is a hydraulic factor, and our systems are made to withstand certain pressures,” Poudel explains. “It shouldn’t even be considered alongside pipe age, length, material, and diameter.”
All three LLMs overemphasized pressure while underemphasizing length, material, and age. So, XGBoost proved to be more accurate than AI in this scenario.
For utilities, the audit isn’t just about technical accuracy. It’s about dollars, too.
Real-world applications, real-world repercussions
Utility directors and city engineers are concerned about cost more than anything.
“AI sounds good in theory, but it doesn’t always align with our systems,” De La Torre explains. “The question is more about how misalignment affects our costs. The audit framework translates that narrative into a quantifiable capital cost, not a theoretical risk.”
Misalignment directly affects how utilities spend their funds. Recognizing this, the Sugar Land team evaluated three different ways to prioritize pipe replacement:
- A ratio-based approach: focuses on risk relative to cost.
- Top probability: ranks the highest risk as the top priority.
- Random selection: no method to the ranking process.
Across utility budgets ranging from $500,000 to $15 million, the ratio-based method proved to be most effective.
“For example, if we take a budget of $1 million, we can expect to prevent 208 pipe failures compared to only 19 for random selection,” De La Torre explains. “That’s a huge difference, and it proves that if we prioritize better, we can prevent far more failures.”
In fact, if pipe replacements are prioritized correctly, utilities can be 15% more efficient in how they spend their funds. As pipes get older and the U.S. infrastructure continues to decline, investing in the right repairs is becoming increasingly critical.
“America has an infrastructure problem,” Barrios says. “We need to make the right investments to improve it or else we’re at risk for a major safety and economic threat.”